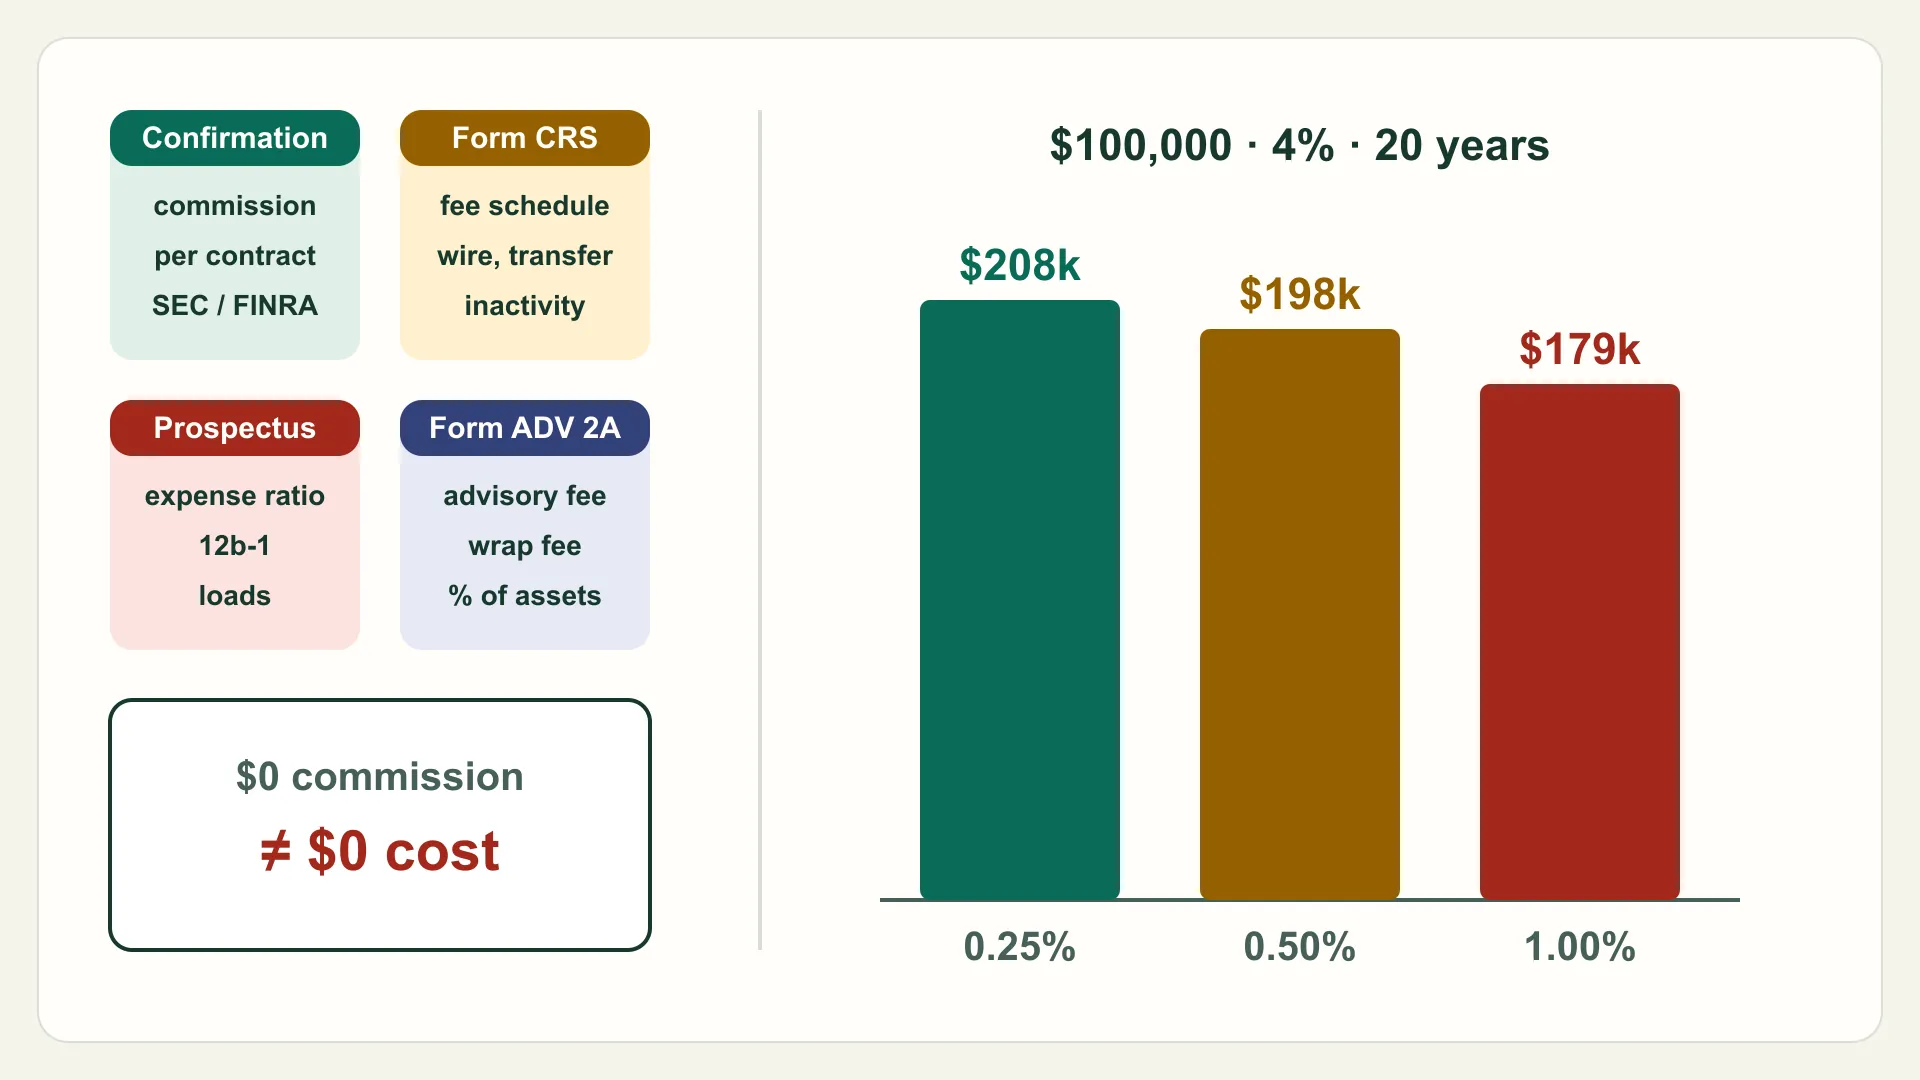
Brokerage fees are easy to underestimate because the largest ones rarely appear as a line on your statement. Investor.gov puts it plainly in its bulletin on fees and expenses: even if you can't readily identify separate fees, you typically pay fees. This guide lists each kind of fee a U.S. brokerage account can charge, shows the document where each one is disclosed, and adds them into a one-year total you can compare across firms. It explains how fees work; it does not rate brokers or recommend an account.
Two kinds of fees: per transaction and ongoing
Investor.gov divides fees into two groups. Transaction fees are charged each time you buy, sell or exchange an investment: commissions, markups or markdowns when a firm trades with you from its own inventory, mutual fund sales loads, and surrender charges on variable annuities. Ongoing fees are charged regularly even when you do not trade: advisory fees based on the value of your portfolio, the annual operating expenses inside funds, and account maintenance fees.
Two costs are not labelled as fees but still reduce what you keep. Cash waiting in the account may earn a low rate depending on where it is swept; compare the options in the cash sweep vs. money market fund guide. And the difference between the buying and selling price of an ETF or stock is a trading cost that no fee schedule lists.
Where each fee is disclosed
Most comparison pages list fees without saying where to verify them. The Investor.gov bulletin names the documents, and FINRA adds that you should receive a firm's Customer Relationship Summary, or Form CRS, before or when you open an account.
| Fee | Charged by | Where to find it |
|---|---|---|
| Commissions, per-contract options charges, markups | The broker | Fee schedule, Form CRS, and the trade confirmation for each trade |
| Account-service fees: maintenance, inactivity, minimum balance, wires, transfers, closing | The broker | Fee schedule and account agreement; often not obvious from statements |
| Margin interest | The broker | Margin agreement and rate table; interest appears on statements |
| Fund expense ratio, 12b-1 fees, sales loads, redemption fees | The fund | The fee table in the fund prospectus; shareholder reports |
| Advisory or wrap fee | The investment adviser or robo-adviser | Form CRS and the adviser brochure (Form ADV Part 2A or its wrap-fee appendix) |
| Regulatory fees on sales | Passed through from the SEC and FINRA | The sale confirmation and the fee schedule |
Fund fees: the charge you never see on a statement
A fund's expense ratio is its total annual operating expenses expressed as a percentage of average net assets. It is deducted from the fund's assets, so it lowers your return without appearing as a separate charge. The Investor.gov bulletin on mutual fund and ETF fees explains that the prospectus fee table shows these expenses along with shareholder fees such as sales loads, redemption fees and exchange fees, and that 12b-1 fees typically apply to mutual funds but not to ETFs.
The same bulletin notes that the prospectus fee table does not show brokerage commissions or other fees to intermediaries, so read the fund and the broker separately. FINRA's Fund Analyzer compares the fees of different mutual funds and ETFs. The index fund vs. ETF vs. mutual fund guide shows how a 0.15% expense difference compares with trading costs.
The small regulatory fees on a sale
A sale confirmation can show charges that are not the broker's own commission. The SEC's Section 31 fee rate advisory for fiscal year 2026 set the rate for most securities transactions at $20.60 per million dollars of covered sales from April 4, 2026, after a $0.00 rate through April 3. On a $10,000 sale that works out to about $0.21. The rate stays in effect until the SEC announces a new one.
FINRA's Trading Activity Fee applies per share on sales of covered equity securities, up to a per-trade maximum. FINRA paused assessment of that fee for transactions from October 1 through December 31, 2026, with assessment scheduled to resume on January 1, 2027. Both fees are owed by firms to regulators; your broker's fee schedule and sale confirmations show whether and how a matching charge is passed to you. Neither applies to purchases.
Margin interest and account-service fees
A margin loan is money borrowed from the broker, and the SEC's guide to margin reminds investors that the firm charges interest on it and that interest reduces total return. Margin rates usually vary with the size of the loan, so read the firm's rate table rather than a headline rate.
Investor.gov also lists brokerage fees that are easy to miss: charges for certain trading platforms, account maintenance, inactivity, not keeping a minimum balance, account transfers, account closings and wire transfers. If you plan to move, check the transfer-out fee first; the brokerage transfer checklist covers the rest of the process.
Add it up: a one-year cost worksheet
Turn every fee into dollars for one realistic year, then divide by the balance. The example below is hypothetical: a $50,000 account holding funds with a weighted expense ratio of 0.10%, four options trades of two contracts each at a hypothetical $0.65 per contract, $12,000 of stock and ETF sales, and one outgoing wire at a hypothetical $25. The managed column adds a hypothetical 0.30% advisory fee.
| Cost item | Calculation | Self-directed | With 0.30% advisory fee |
|---|---|---|---|
| Fund expense ratios | $50,000 × 0.10% | $50.00 | $50.00 |
| Advisory fee | $50,000 × 0.30% | — | $150.00 |
| Stock and ETF commissions | $0 per trade | $0.00 | $0.00 |
| Options contract charges | 4 trades × 2 contracts × $0.65 | $5.20 | $5.20 |
| Section 31 fee on sales | $12,000 × $20.60 ÷ $1,000,000 | $0.25 | $0.25 |
| Outgoing wire | 1 × $25 | $25.00 | $25.00 |
| Total for the year | Share of a $50,000 balance | $80.45 (0.16%) | $230.45 (0.46%) |
Percentages matter because they compound. Investor.gov's example takes $100,000 growing 4% a year for 20 years: with a 0.25% annual fee it ends near $208,000, with 0.50% near $198,000, and with 1.00% near $179,000. Applying the same method to the worksheet, treating each total as a yearly percentage, the self-directed account would end near $106,100 and the managed one near $99,900 from the same $50,000. Those are illustrations, not forecasts; returns vary, and advice may be worth its cost to you. The point is to see the cost before deciding.
Nortune's calculation is ending value = starting balance × ((1 + growth rate) × (1 − annual fee rate))years, which reproduces the Investor.gov figures. You can test other rates in the investment and savings calculator.
Turn the page into action
Find every fee in about 15 minutes
- Open the firm's Form CRS and its full fee schedule; note every charge that could apply to how you use the account.
- For each fund you hold, read the prospectus fee table or compare it on FINRA's Fund Analyzer.
- If you pay for advice, find the fee in the adviser brochure (Form ADV Part 2A) or the wrap-fee brochure.
- Look at your last sale confirmation for commission, contract and regulatory fee lines.
- Check the margin rate table if you borrow, and the transfer-out and closing fees before you move.
- Total one year in dollars and as a percentage of your balance, then compare like with like.
Compare brokers on total cost
Use the yearly total, not the headline commission, when you compare brokers and investing platforms. Nortune's individual broker reviews list each firm's published prices as of their review date; confirm them against the firm's current fee schedule before opening or funding an account. This guide covers U.S. accounts only; fees and disclosure documents differ in Puerto Rico for local products, in Japan and elsewhere.
Evidence to action
Methods and evidence
Methods used
- Ending value after an annual fee
V = P × ((1 + g) × (1 − f))^n, where g is the annual growth rate, f the annual fee rate and n the number of years
Next actions
Structured datasources.jsonformulas.jsonsystems.json
Evidence
Sources
- How Fees and Expenses Affect Your Investment Portfolio – Investor Bulletin
investor-gov-fees-expenses-bulletinU.S. Securities and Exchange Commission (Investor.gov)PublishedJuly 23, 2025AccessedNovember 9, 2026
- Mutual Fund and ETF Fees and Expenses – Investor Bulletin
investor-gov-fund-etf-fees-bulletinU.S. Securities and Exchange Commission (Investor.gov)PublishedJuly 23, 2025AccessedNovember 9, 2026
- Section 31 Transaction Fee Rate Advisory for Fiscal Year 2026
sec-section-31-fee-rate-fy2026U.S. Securities and Exchange CommissionPublishedFebruary 27, 2026AccessedNovember 9, 2026
- SR-FINRA-2026-021: Proposed Rule Change to Temporarily Pause Assessment of the Trading Activity Fee
finra-taf-pause-2026Financial Industry Regulatory AuthorityAccessedNovember 9, 2026
- Brokerage Accounts
finra-brokerage-accountsFinancial Industry Regulatory AuthorityAccessedNovember 9, 2026
- Margin: Borrowing Money to Pay for Stocks
sec-margin-borrowingU.S. Securities and Exchange CommissionAccessedNovember 9, 2026
Common questions
Frequently asked questions
What fees can a brokerage account charge?
Transaction fees such as commissions, per-contract options charges, markups and sales loads; ongoing fees such as fund expense ratios and advisory fees; margin interest; and account-service fees for things like wires, transfers, inactivity or paper statements. Small regulatory fees can also apply to sales.
Is a $0-commission brokerage account free?
No. Investor.gov notes that even when separate fees are hard to identify, you typically pay fees. A $0 commission removes one charge, but fund expenses, advisory fees, margin interest, account-service fees and regulatory fees on sales can still apply.
What is the SEC fee on a stock sale?
It is the Section 31 transaction fee. From April 4, 2026 the SEC set the rate at $20.60 per million dollars of covered sales, which is about $0.21 on a $10,000 sale. Check your sale confirmation and fee schedule for how your broker passes it on.
Where do I find a fund's expense ratio?
In the fee table near the front of the fund's prospectus, listed as total annual fund operating expenses. It is deducted inside the fund, so it does not appear as a line on your brokerage statement. FINRA's Fund Analyzer can compare funds.